As discussed in one of the previous articles, the implementation of visual analytics requires the use of software that is suitable for the specific field of application. This article will focus on visual analytics solutions appropriate for analyzing large amounts of business data in areas such as supply chain management, finance, marketing, human resources, and many more.
Given that visual analytics is a fairly new field, currently there is no separate group for visual analytics tools on the software market and they are rather referred to as business intelligence solutions. However, this classification is not entirely accurate. The reason for this is that tools for visual analytics should support three main functions – data management, analytics, and visualization. While business intelligence solutions fulfill the first two requirements by providing data management and analytics functionalities, they have limited visualization capabilities.[1] It is true that every business intelligence tool is capable of producing charts or dashboards. However, they only allow limited exploration and interaction with the generated visualizations. Since by definition visual analytics “combines automated analysis techniques with interactive visualizations” and knowledge is gained from automated analysis, visualization, as well as the interaction between visualizations, models, and users, advanced visualization techniques are essential for enabling the human involvement in the process and therefore a crucial part of every software tool for visual analytics. The real-time interaction with the system makes it possible for the user to dynamically change the parameters of the analysis and fully utilize human strengths such as perception and cognition in order to discover patterns, trends and other relationships in the data. That is why visual analytics tools move beyond business intelligence. They build on what has been achieved with business intelligence technology and add graphical user interfaces that support data interaction and exploration based on research into human perception and cognition.[2] Modern tools for visual analytics further improve the user experience by implementing advanced algorithms to automatically generate visualizations based on the available data and suggest relevant information for the user to interact with and explore further.
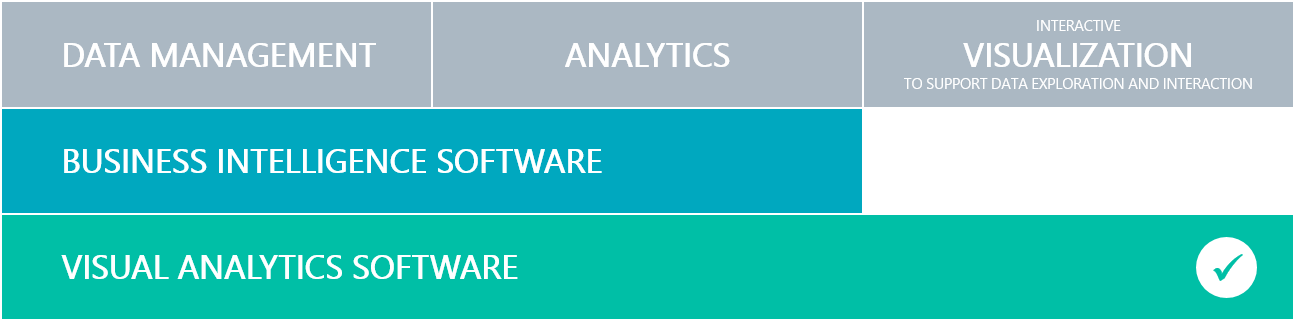 Visual analytics software
In order to contribute to the creation and proper evaluation of software tools for visual analytics, a taxonomy of interactive dynamics for visual analysis was introduced. It consists of twelve elements divided into three categories that enable iterative visual analysis and thus allow users to surpass the limits imposed by business intelligence solutions and increase the quality of their analyses. These requirements are introduced below.[3]
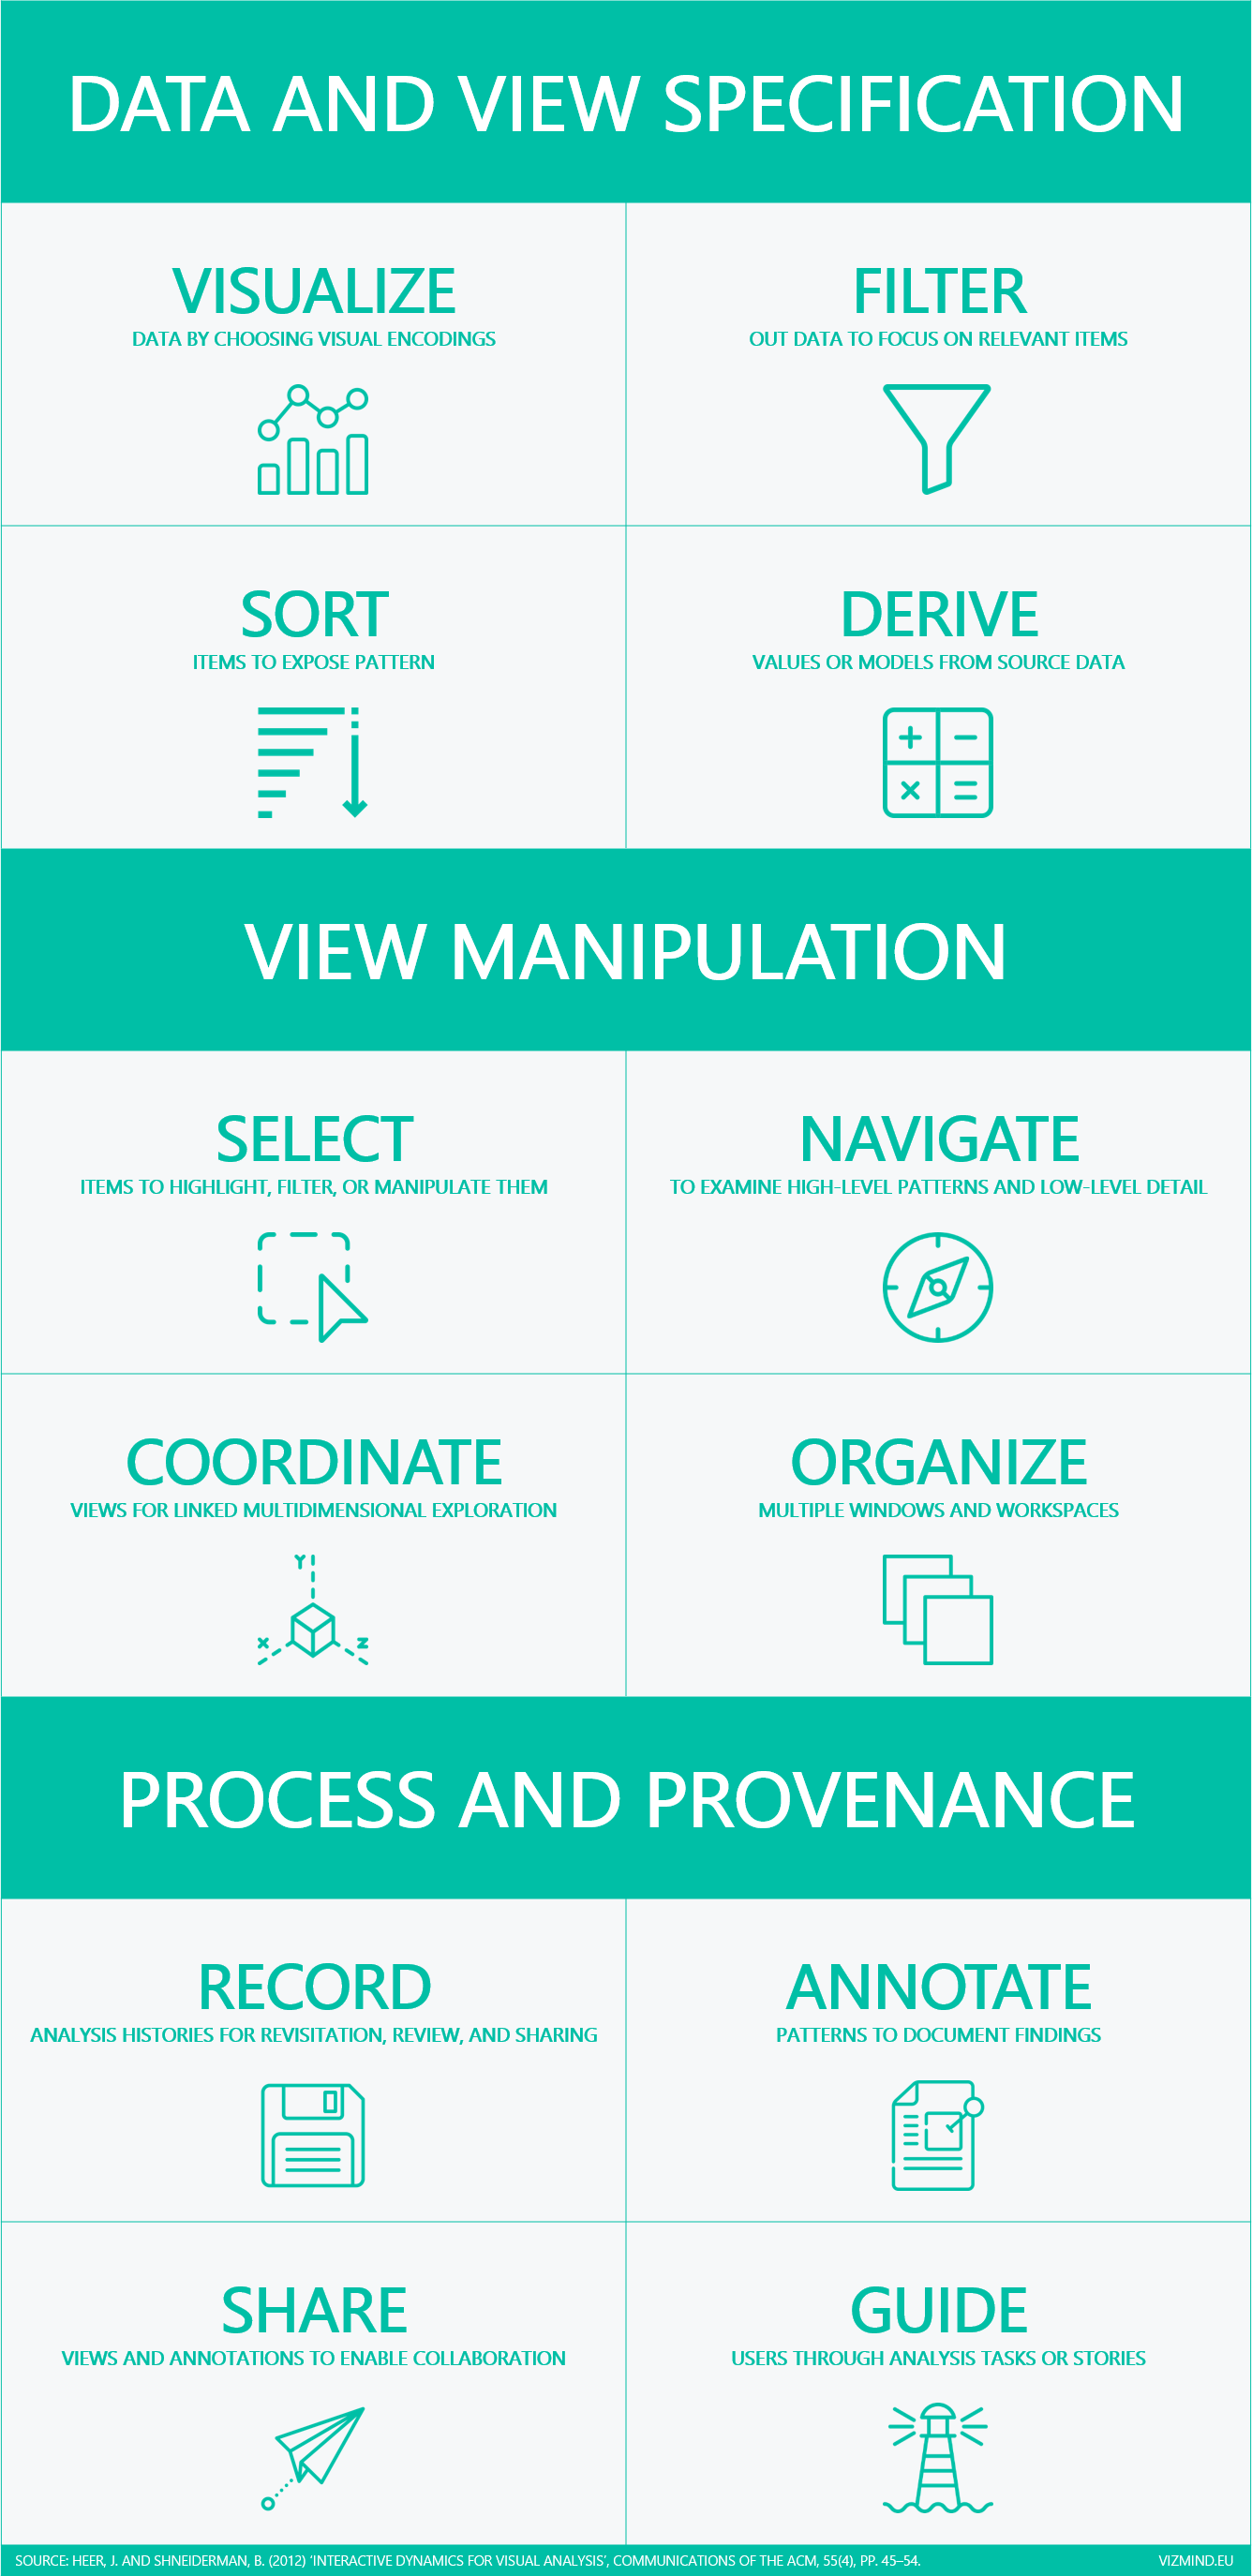 Taxonomy of interactive dynamics for visual analysis[3]
The first category Data and View Specification suggests that tools for visual analytics should provide controls for specifying the data and views of interest and make it possible for the user to visualize the data in a selective manner, to filter out irrelevant information, to discover patterns by sorting information, and to derive new information from the input data.
The category View Manipulation is related to the ability to control the visualization so that the user can select specific items or data regions of interest. Software tools should also provide smooth navigation experience (e.g. scrolling, zooming, and panning). Furthermore, the visual analytics system is required to support multiple linked visualizations and several workspaces.
Finally, the Process and Provenance category indicates that tools for visual analytics are not restricted to the creation and manipulation of visualizations. They should also be capable of keeping a record of the analysis for future reference. It must also be possible for the user to annotate his findings (e.g. with explanatory text) and share them with other users. Last but not least, the system should be able to guide users through the tasks or lead viewers through an analysis story.[3]
Since visual analytics is used for analyzing big data, tools should be able to handle large amounts of information. Ideally, interactive operations should be completed within a fraction of the second and the result should appear instantly on the display. In order to achieve this, modern software solutions employ in-memory computing and load the data into the computer’s random access memory (RAM).[4] Analyzing data within the RAM is much faster and, what is more, the system does not depend on a database server. Additionally, a visual analytics tool needs to be able to work with simple hardware (e.g. desktop computers and laptops) as well as with complicated networks of multiple computers linked to different databases.[5]
In conclusion, when selecting a software solution for visual analytics, it is crucial to conduct a thorough evaluation. While major market research reports can be a useful reference point for getting a broad overview of the landscape, their recommendations should be taken with a grain of salt in the context of visual analytics. For instance, Gartner‘s Magic Quadrant for Analytics and Business Intelligence encompasses both business intelligence and visual analytics tools under a single umbrella and does not fully highlight the distinctions and advantages of visual analytics tools over traditional business intelligence tools, as discussed in this article. Furthermore, it places significant emphasis on the current market hype and hype-driven assessments rarely align with the specific needs and long-term goals of organizations. Therefore, the information provided in such reports should be supplemented with in-depth vendor assessments, hands-on testing, and gathering feedback from users who have experience with the tools in real-world scenarios to ensure that the chosen tool aligns with the unique requirements and advantages of visual analytics over traditional business intelligence.
[1] Cybulski, J.L., Keller, S., Nguyen, L. and Saundage, D. (2015) ‘Creative problem solving in digital space using visual analytics’, Computers in Human Behavior, 42, pp. 20–35.
[2] Stodder, D. (2015) TDWI Best Practices Report. Visual Analytics for Making Smarter Decisions Faster. Applying Self-Service Business Intelligence Technologies to Data-Driven Objectives. TDWI Research.
[3] Heer, J. and Shneiderman, B. (2012) ‘Interactive Dynamics for Visual Analysis’, Communications of the ACM, 55(4), pp. 45–54.
[4] Fekete, J.-D. (2013) ‘Visual Analytics Infrastructures: From Data Management to Exploration’, IEEE Computer Society, 46(7), pp. 22–29.
[5] Lawton, G. (2009) ‘Users Take a Close Look at Visual Analytics’, IEEE Computer, 42(2), pp. 19–22.