The previous article provided a short introduction to visual analytics and pointed out that it integrates visualization, automated data analysis, and human factors. Therefore, science, technology, and methodologies from various areas are related to the field.[1] The following figure illustrates the disciplines of visual analytics:
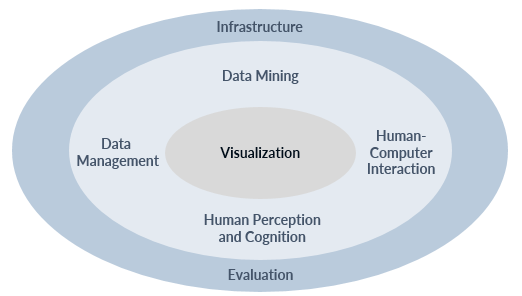 Visual analytics disciplines[1][2]
Visualization is in the center of the system. Following the definition of visual analytics, it can be stated that visualization is the medium between automated data analysis and human factors. Data analysis concerns the use of techniques from the fields of data management and data mining. With regard to human factors, the human perception and cognition as well as the interaction between human and computer are taken into account. Finally, visual analytics requires an infrastructure and suitable methods for evaluation.[2]
Visualization
Visualization can be generally classified into information and scientific visualization. Information visualization is concerned with the visual representation of abstract datasets, e.g. business and demographics data, with no specific relation to spatial data.[3] It supports the exploration of large datasets that otherwise cannot be comprehended by the user and makes patterns and trends discoverable.[4] The term is also applied to the visual representation of non-numerical information such as bibliographic databases and networks of relations.[5]
Scientific visualization focuses on the representation of three dimensional data. It is used in various fields where realistic renderings, e.g. of surfaces or volumes, are of high importance. Examples include architecture, meteorology, and biology.[5] Furthermore, unlike information visualization, in scientific visualization the spatial representation is given[6] and the data has explicit references to time and space.[2] Spatial data represents the physical world, e.g. geographic coordinates, while temporal data refers to data where changes over time are of interest. The analysis of spatio-temporal data, i.e. data with reference both to time and space, is a challenging task due to complexities of scale and uncertainty.[7] Advanced tools are needed in order to take advantage of such data. Therefore, research in scientific visualization is focused mainly on making visualization techniques more efficient.[1]
Data management
The effective data management is an important part of the visual analytics process as it provides the data that needs to be analyzed.[1] Nevertheless, the management of data is not only limited to storing, creating, and deleting information. It supports the decision-making process, creates value from data, and encourages further analysis.[8] Moreover, data management is concerned with various areas such as discovery, access, quality, integration, and governance of data.[9] Until the last decade, research in the area was concentrated mainly on optimizing the work with homogeneous and structured datasets. In the recent years, however, it has moved towards the integration of large volumes of heterogeneous and unstructured data. The goal is that information is available in a near-real time and as automated as possible.[2]
Data mining
Data mining is a process that uses statistical and mathematical techniques as well as pattern recognition technologies in order to discover correlations, patterns, trends, and relationships hidden in large datasets and make the data understandable and usable.[10] Notable methods for data mining include supervised learning from examples and cluster analysis. Supervised learning algorithms analyze training data in order to produce models for processing new and unknown datasets. On the other hand, cluster analysis techniques use a different approach and divide data instances into groups based on their similarity to each other. As with data management, the research in data mining has shifted from analyzing structured datasets towards analyzing more complex data.[2] An approach called visual data mining can be used in order to deal with the increased complexity of the process. It provides an interface which allows the user’s interaction with the data.[11]
Human perception and cognition
Perception and cognition are related to the involvement of the human factor in visual analytics and play a central role in the decision-making process.[12] Perception is the ability to receive and interpret information from the surrounding environment, e.g. from diagrams on a computer screen. Cognition is the action of acquiring knowledge and understanding the visual information mainly based on prior learning and experience.[1] The research in this area concerns two main topics – science and technology. On the scientific side, knowledge from disciplines such as psychology, sociology, and neurosciences is used in order to better understand the process of perception and cognition of visual information and develop methods and tools for more efficient visualization and exploration of information. On the technical side, research is focused on improving hardware (e.g. increasing the quality of displays used for visualization) and developing algorithms that combine recognition of the user’s intention and suitable data representation.[2]
Human-computer interaction
As the name suggests, human-computer interaction (HCI) studies the interaction between humans and computers. In addition to this general definition, five aspects (areas of study) of the field have been identified.[13] Hence, the purpose of HCI is to:
- Develop interactional techniques and suggest where and in what situations they might be beneficial.
- Enable the building of more usable computer systems by taking into account the knowledge users possess and how they interact with these systems.
- Ensure that systems provide users with the functionality and the information they need without excessive effort on the users’ side.
- Optimize the design and development process and suggest design improvements by considering the user (user-centered design).
- Ensure that new systems do not have a negative impact on organizations or individuals and groups within them (e.g. job deskilling).
Research in HCI is directed towards improving the interaction between users and computers and making computers capable of identifying users’ intentions and needs. Therefore, the research areas regarding human perception and cognition discussed in the section above are related to HCI as well. In terms of visual analytics, it is essential to build an effective user interface that will make the combination of human and computer strengths possible.[2]
Infrastructure
The purpose of the infrastructure is to provide users with the opportunity to efficiently and effectively explore data.[1] With regard to visual analytics, software infrastructures should support exploration and interaction in the analysis of large and complex datasets. In order to achieve this objective, they need to provide some fundamental functions represented by three main layers – data management (to store, recover, and distribute the data to the other layers), analytics (to examine, summarize, and extract information from the data), and visualization (to ensure that the information extracted from the data is effectively communicated to the user). In contrast to analytics systems that are designed to perform complex analyses as precisely as possible in unbounded time, visual analytics aims at quickly providing initial results with the possibility to later increase the precision of the analysis if necessary. Furthermore, it is important for the user to be able to dynamically change the parameters of the analysis. Hence, the possibility for real-time interaction with the system is another critical factor for the software infrastructure.[14] Currently, there are many applications for visual analytics that are custom-built and one of a kind due to incompatibility of software infrastructures created by different technologies.[1] Therefore, further development is needed in order to achieve a higher integration of data management, analytics, and visualization.[14]
Evaluation
Evaluation of visual analytics environments is a critical factor for moving research into practice and making progress. Its purpose is to ensure that algorithms and software systems work properly and that they can improve the current infrastructure.[15] Evaluation is related to subjects such as effectiveness and efficiency of software tools, techniques, methods, models, and theories. It also includes various aspects such as user satisfaction, performance, ease of use, and how the tools fit into current systems. Due to the interdisciplinary nature of visual analytics, assessing the methods used in the field is a challenging task.[16] As a result of the high complexity, traditional metrics for evaluation applicable in other disciplines are not sufficient for assessing visual analytics tools.[17] Therefore, more research towards developing a theoretically founded evaluation framework for visual analytics is still needed. It will provide a better understanding of the field and support the development of new methods and techniques.[18]
[1] Keim, D., Kohlhammer, J., Ellis, G. and Mansmann, F. (2010) Mastering the Information Age: Solving Problems with Visual Analytics. Goslar: Eurographics Association.
[2] Keim, D., Andrienko, G., Fekete, J.-D., Görg, C., Kohlhammer, J. and Melancon, G. (2008) ‘Visual Analytics: Definition, Process, and Challenges’, in Kerren, A., Stasko, J.T., Fekete, J.-D., and North, C. (eds.) Information Visualization. Berlin, Heidelberg: Springer-Verlag, pp. 154–175.
[3] Nagel, H.R. (2006) ‘Scientific Visualization versus Information Visualization’, Workshop on state-of-the-art in scientific and parallel computing. Sweden, pp. 1–4.
[4] Lemieux, V.L., Gormly, B. and Rowledge, L. (2014) ‘Meeting Big Data challenges with visual analytics’, Records Management Journal, 24(2), pp. 122–141.
[5] Friendly, M. (2009) Milestones in the history of thematic cartography, statistical graphics, and data visualization.
[6] Munzner, T. (2008) ‘Process and pitfalls in writing information visualization research papers’, in Kerren, A., Stasko, J.T., Fekete, J.-D., and North, C. (eds.) Information Visualization. Berlin, Heidelberg: Springer-Verlag, pp. 134–153.
[7] Khemiri, W. (2011) Data-intensive interactive workflows for visual analytics. Universite Paris Sud – Paris XI.
[8] SAS Institute (2014) Data Management: What You Need to Know and Why.
[9] McNeill, F. and Agresta, R. (2015) The Future of Data Management.
[10] Larose, D.T. (2005) Discovering knowledge in data: An introduction to data mining. Hoboken, New Jersey, United States: John Wiley & Sons.
[11] Eidenberger, H. (2004) Visual Data Mining. Vienna: Vienna University of Technology.
[12] Keim, D., Mansmann, F., Stoffel, A. and Ziegler, H. (2009) ‘Visual Analytics’, in Özsu, M.T. and Liu, L. (eds.) Encyclopedia of Database Systems. New York: Springer US, pp. 3341–3346.
[13] Booth, P. (2014) An Introduction to Human-Computer Interaction. United Kingdom: Psychology Press.
[14] Fekete, J.-D. (2013) ‘Software and Hardware Infrastructures for Visual Analytics’, IEEE Computer, 43(8), pp. 1–7.
[15] Scholtz, J., Plaisant, C., Whiting, M. and Grinstein, G. (2013) ‘Evaluation of visual analytics environments: The road to the Visual Analytics Science and Technology challenge evaluation methodology’, Information Visualization, 13(4), pp. 326–335.
[16] Van Wijk, J.J. (2013) ‘Evaluation: A Challenge for Visual Analytics’, IEEE Computer, 46(7), pp. 56–60.
[17] Plaisant, C., Grinstein, G. and Scholtz, J. (2009) ‘Visual-Analytics Evaluation’, IEEE Computer Graphics and Applications, 29(3), pp. 16–17.
[18] Keim, D., Zang, L., Krstajić, M. and Simon, S. (2012) ‘Solving Problems with Visual Analytics: Challenges and Applications’, Journal of Multimedia Processing and Technologies, 3(1), pp. 1–11.