This article describes several models related to the visual analytics process. They are ordered according to the year in which they were introduced. The same color codes as in the figure visualizing the visual analytics process are applied again in order to better depict the relationship between the models.
Knowledge discovery in databases
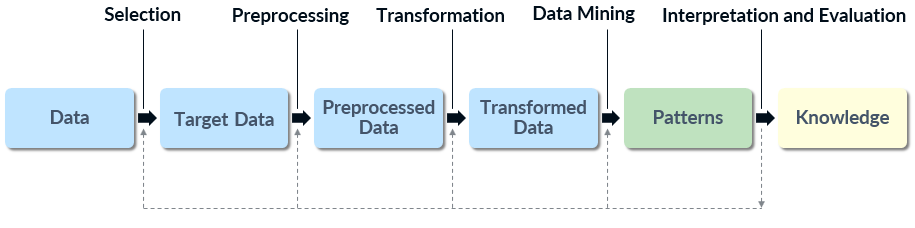
The knowledge discovery in databases (KDD) process was proposed in 1996. It is focused on making sense out of data using data mining techniques for pattern discovery and extraction. The process maps low-level data into more compact, abstract, or useful forms and aims at discovering or extracting patterns that can be turned into knowledge.[1] Even though data mining is essential for pattern discovery, it represents just a single step of the process, which highlights the significance of data preparation.[2] The KDD process, as illustrated below, can be linked to the Data > Model > Knowledge path of the visual analytics process.
 Knowledge discovery in databases process[1]
The KDD process consists of five steps:[2]
- Selection: sets the goal of the KDD process and selects a target dataset that is likely to contain relevant patterns.
- Preprocessing: cleans and prepares the dataset by supplementing missing data, removing duplicate entries, and resolving data inconsistencies.
- Transformation: reduces the data depending on the goal and derives new significant attributes.
- Data mining: selects a data mining algorithm with regard to the goal and derives patterns that are relevant to the dataset.
- Interpretation and evaluation: interprets the discovered patterns, checks their validity, and examines the usefulness of the derived knowledge.
The KDD process is interactive and repetitive. While interpreting the discovered patterns, the user has the possibility to return to previous steps and select different data or adjust or even change the data mining algorithm. The goal is to increase the quality of the patterns by improving the applied methods and thus to achieve a better overall result.[2] Finally, the discovered knowledge can be used, documented, or employed to resolve inconsistencies with previously believed knowledge.[1]
Visualization pipeline
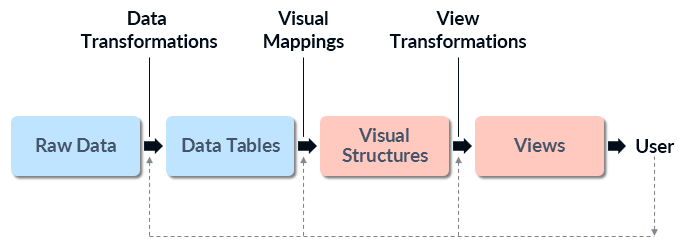
The visualization pipeline, also known as visualization reference model[3] or InfoVis pipeline, was first introduced in 1999 with the goal to use images derived from data in order to help users explore large datasets.[4] The model considers visualizations as adjustable mappings from data to visual form to user.[3] It can be connected to the Data > Visualization path of the visual analytics process.
 Visualization pipeline[3]
The visualization pipeline includes three steps:[5]
- Data transformations: transform raw data into more structured data tables which also include metadata.
- Visual mappings: create visual structures such as box plots, color-codings, or charts from the data tables.
- View transformations: the visual structures are further transformed into views (images) which are presented to the user. This step also includes the specification of parameters that are not related to the actual data (e.g. selection of the visualization’s color code).[6]
After the views are available, the user can return to any of the steps in the visualization pipeline and interact with them in order to improve the result. Possible adjustments include altering the metrics used to produce data tables, changing the desired output of the visual mappings, or zooming and panning the visual structures to change the point of view.[5]
The visualization pipeline takes the role of the user into account but does not consider the generation of knowledge as an ultimate goal of the process. The model is rather concentrated on using visualization to explore large amounts of data and follows the guide to visually exploring data discussed in the previous article – “overview first, zoom and filter, details on demand”. First, the user is provided with an overview of the data so that relations and patterns in the dataset can be discovered. After that, he can concentrate on a specific field of interest and interact with the steps in the visualization pipeline in order to access the desired details of the data.
Visualization model
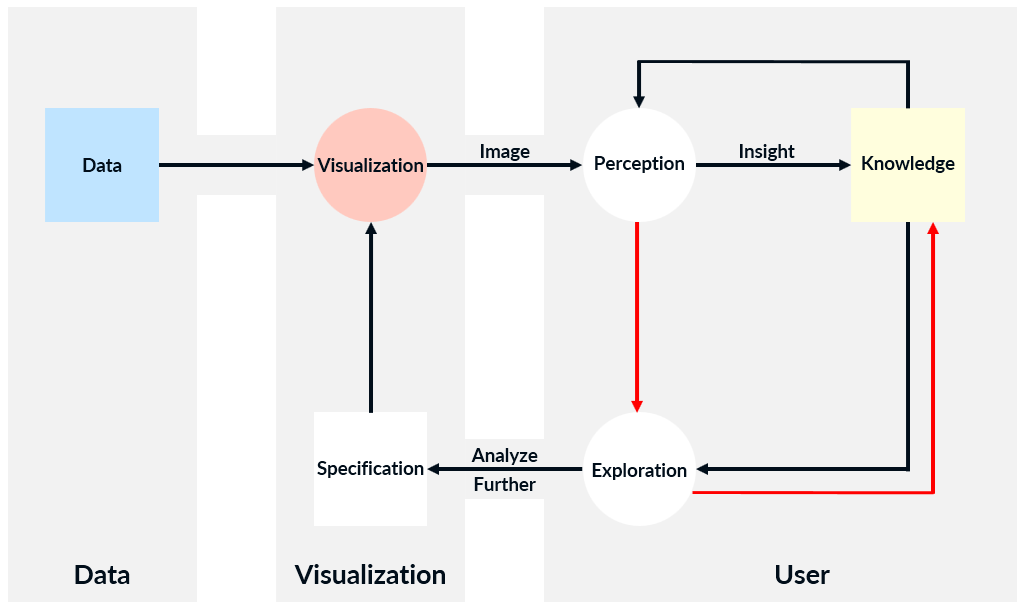
The visualization model introduced in 2005 is an abstract model that consists of three blocks – Data, Visualization, and User – and aims at gaining knowledge through visualization of data.[7] Three years later, the original model was revised and updated[8] by adding directional arrows in the User block.[9] The visualization model, including the later modification (the two red arrows), is presented in the figure below. It corresponds to the Data > Visualization > Knowledge path of the visual analytics process. Boxes in the model indicate containers, ovals represent processes, and arrows denote transitions.[7]
 Updated visualization model[8]
The visualization model includes several steps. At the beginning, the data is transformed into an image according to user’s specification such as which hardware, algorithms, and parameters to be used. Then the process enters a loop where the image is first perceived by the user. This provides an insight which leads to the generation of new knowledge or increase in existing one. As a next step, the user may decide to further explore the data and based on his current knowledge to adjust the specification of the visualization in order to improve the result.[7]
Further research suggests that the link between perception, interactive exploration, and knowledge is stronger than the model initially implied.[8] In order to depict this relationship, two directional arrows are added to the original model. The first one connecting Perception to Exploration indicates that perception plays a significant role in interactive exploration. The second arrow linking Exploration to Knowledge implies that the act of exploration and associated reasoning often results in knowledge. The authors base their arguments on the implications of the human cognition model. It is described in the next section.
Human cognition model
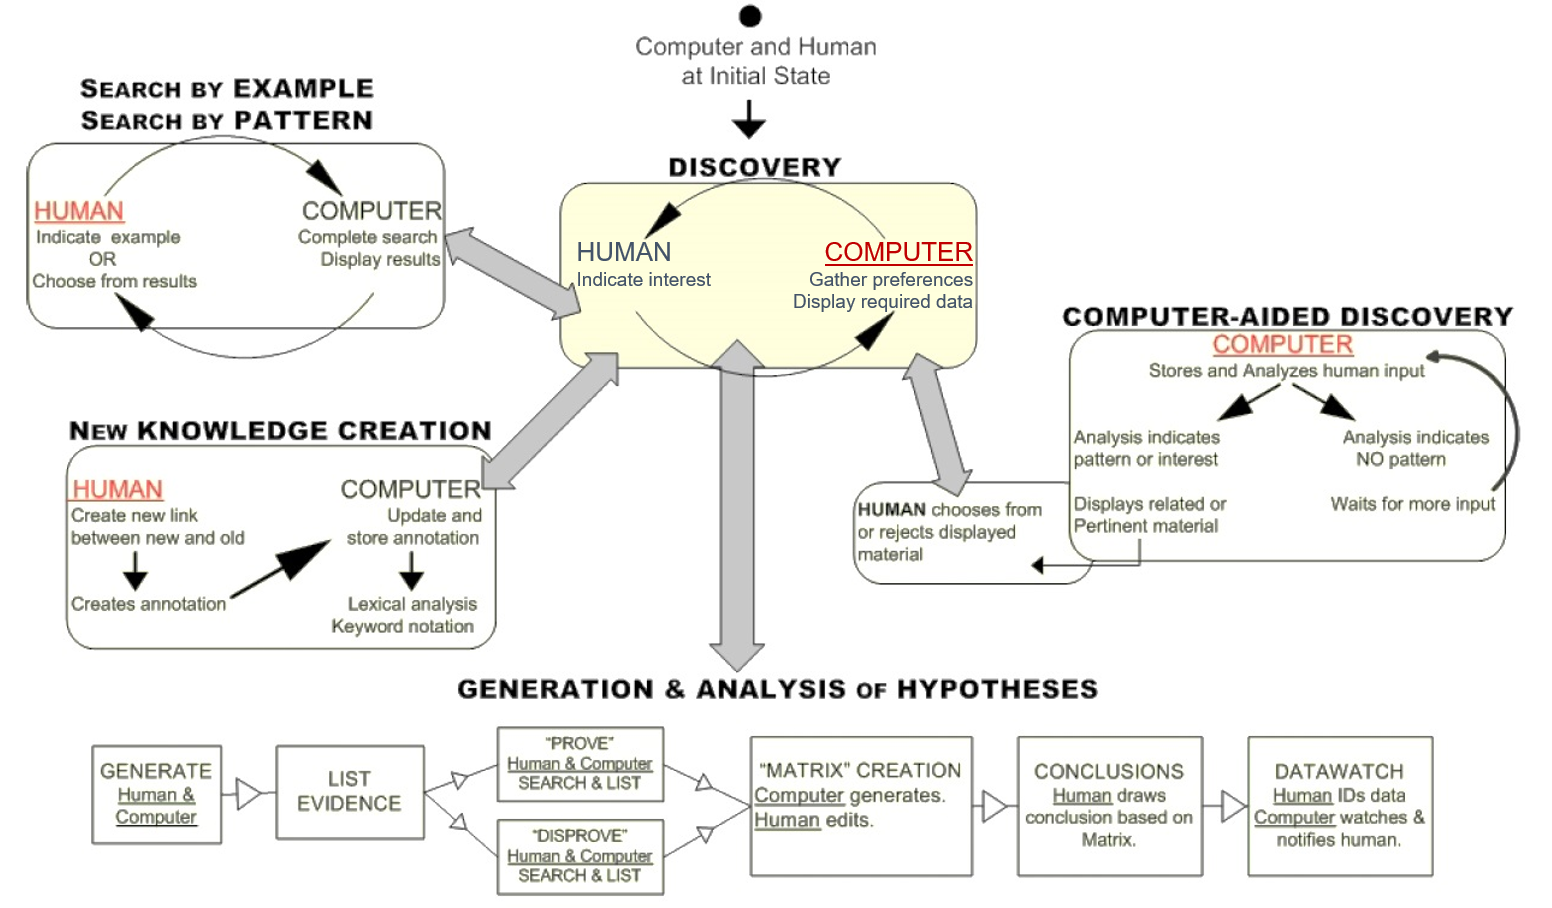
As it was stated in one of the previous articles, the work in the field of human perception and cognition is mainly related to science and technology. The human cognition model (HCM) introduced in 2008 combines these two aspects. It is based on research in the reasoning and decision-making processes of human cognition as well as research related to information visualization. Furthermore, it aims at supporting the development of interactive knowledge visualization interfaces that should allow better collaboration between human and computer.[10] The HCM showed in the figure below can be linked to that part of the visual analytics process where the user draws conclusions based on the provided insight which leads to the generation of knowledge, namely the Visualization > Knowledge and Model > Knowledge paths.
 Human cognition model[10]
The underlined red words in the model indicate the process’ initiator. The central process of the HCM is Discovery which relates to the Knowledge oval of the visual analytics process. During knowledge discovery the computer mitigates the human cognitive overload by displaying relevant information. This allows the user to perceive the information, interact with it, and turn it into knowledge. The sub-processes of the HCM support Discovery and thus the generation of knowledge. Since the HCM is a collaborative model, the computer does not only present the information but also recognizes the user’s intention. Through Computer-Aided Discovery it acts in a more active way by analyzing the user’s input and suggesting data that has not been explored yet. The user can then accept or reject the suggestion which ensures that no relevant information is overlooked. Another sub-process is New Knowledge Creation where a human may uncover new data relationships. They are then stored by the computer and made available to other users for further analysis. In case the desired information is not displayed in the visualization, the user may have to search for it. This is denoted by the sub-process Search by Example / Search by Pattern. Rather than using a traditional text search box, the authors of the model propose a more intuitive search triggered by graphically indicating a data representation or by drawing a bounding box around a data pattern. Finally, the HCM includes the sub-process Generation & Analysis of Hypotheses. It also involves an active collaboration between human and computer and the strengths of both are utilized in order to generate and then prove or disprove a hypothesis. The final conclusion is drawn by the user and stored by the computer.[10]
Knowledge generation model for visual analytics
The knowledge generation model for visual analytics was revealed in 2014. It takes the visual analytics process as a basis and extends it by replacing the Visualization > Knowledge and Model > Knowledge paths with loops that model the human cognitive processes in order to describe in detail how knowledge is generated.[9] The model is presented below.
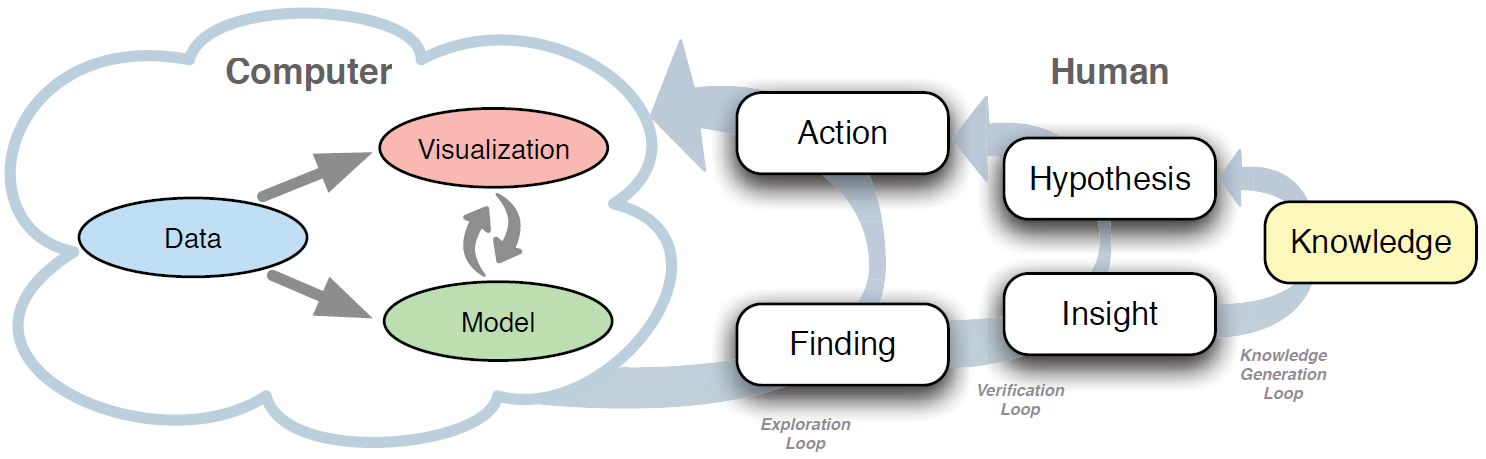 Knowledge generation model for visual analytics[9]
The knowledge generation model consists of computer part and human part. The cloud in the model shows that the two parts are not clearly separated since they are both needed for data analysis. While the computer system remains unchanged compared to the visual analytics process, the human side is completely restructured. The meaning of the three loops and their elements is explained as follows based on the definitions provided in [9].
- Exploration loop: describes how users interact with the system in order to create new models or visualizations and analyze the data. The actions taken in the exploration loop depend on findings or defined analytical goals.
- Verification loop: steers the exploration loop to prove or disprove a hypothesis. A new hypothesis formulated in the verification loop is based on an insight.
- Knowledge generation loop: the knowledge gained as a result of the visual analytics process may influence the generation of a new hypothesis in the verification loop.
- Finding: an observation made by the user that can be based on data, visualizations, models, or anything interesting resulting from the use of the visual analytics system. A finding can activate a basic action such as zooming in on a part of the visualization. The user can also gain a new insight from a finding when he is able to understand and interpret it in the context of the area of interest.
- Action: a task that triggers a response from the visual analytics system. An action derived from a finding is usually simple, e.g. adjusting the data mining algorithm. On the other hand, if an action is derived from a hypothesis, it can be more complex, e.g. using a specific visualization method capable of providing evidence for verifying or denying the hypothesis.
- Insight: a unit of information generated by interpreting a finding. The insight could be small, e.g. discovering some characteristic of the data, or more important and possibly having a high significance for the analysis. By interpreting a finding and collecting enough evidence the user can formulate a new hypothesis. If the evidence is very strong, it might lead to an insight that can be accepted as new knowledge.
- Hypothesis: formulates an assumption about the problem that is being analyzed. It triggers an action in the exploration loop and has a central role in the entire process since proving or disproving a hypothesis leads to generation of knowledge. A hypothesis can be formulated based on insight or from already available knowledge about the problem domain.
- Knowledge: the ultimate goal of the process. When the user finds enough evidence in the data and trusts the insight, he gains knowledge about the problem domain. This knowledge can also influence the creation of a new hypothesis.
Once more, the knowledge generation model for visual analytics emphasizes the importance of the collaboration between human and computer. Furthermore, since the model uses the visual analytics process as a basis, it can be easily related to all other models described in this article. There is a particularly strong connection to the HCM due to the fact that both models are focused on the reasoning process on the human side and highlight the interplay between user and machine.
[1] Fayyad, U., Piatetsky-Shapiro, G. and Smyth, P. (1996) ‘From Data Mining to Knowledge Discovery in Databases’, AI Magazine, 17(3), pp. 37–54.
[2] Kriegel, H.-P. and Schubert, M. (2009) ‘KDD Pipeline’, in Özsu, M.T. and Liu, L. (eds.) Encyclopedia of Database Systems. New York: Springer US, pp. 1586–1587.
[3] Card, S. (2008) ‘Information Visualization’, in Sears, A. and Jacko, J.A. (eds.) The Human-Computer Interaction Handbook: Fundamentals, Evolving Technologies and Emerging Applications. Lawrence Erlbaum Associates, pp. 509–544.
[4] Davey, J., Mansmann, F., Kohlhammer, J. and Keim, D. (2012) ‘Visual Analytics: Towards Intelligent Interactive Internet and Security Solutions’, Lecture Notes in Computer Science, 7281, pp. 93–104.
[5] Fittkau, F. (2015) Live Trace Visualization for System and Program Comprehension in Large Software Landscapes. Books on Demand.
[6] Ward, M., Grinstein, G. and Keim, D. (2015) Interactive Data Visualization: Foundations, Techniques, and Applications. Boca Raton: CRC Press.
[7] Van Wijk, J.J. (2005) ‘The Value of Visualization’, IEEE Visualization, 2005. VIS 05. United States, IEEE. pp. 79–86.
[8] Green, T.M., Ribarsky, W. and Fisher, B. (2008) ‘Visual Analytics for Complex Concepts Using a Human Cognition Model’, IEEE Symposium on Visual Analytics Science and Technology, 2008. VAST ’08. United States, IEEE. pp. 91–98.
[9] Sacha, D., Stoffel, A., Stoffel, F., Kwon, B.C., Ellis, G. and Keim, D. (2014) ‘Knowledge Generation Model for Visual Analytics’, IEEE Transactions on Visualization and Computer Graphics, 20(12), pp. 1604–1613.
[10] Green, T.M. and Ribarsky, W. (2008) ‘Using a human cognition model in the creation of collaborative knowledge visualizations’, SPIE Defense and Security Symposium. International Society for Optics and Photonics.