Whether you are supporting ten or ten thousand users, as a tenant admin you would like to know how often they log in. The SaaS editions of Qlik Sense currently do not provide this kind of information out of the box. However, there is an easy way to create a simple monitoring app using the available APIs. Let’s see how to get the data and build a data model.
This article assumes that you already have an API key and you are familiar with the process of creating data connections. For more information, please go through Step 1 – API Key and Step 2 – Data connection in Tracking New Users in SaaS Editions of Qlik Sense before you continue.
Step 1 – Data Connections
We need two APIs – Users and Audits. The first one, as the name suggests, provides information about the users. The second one shows what goes on in the tenant.
First, let’s connect to the Users API. Create a new app in one of your spaces (the space used in this example is called Monitoring) and open the data load editor. Then set up a new REST connection with the following settings:
Request > URL
https://tenant.region.qlikcloud.com/api/v1/users?status=active,disabled,deleted

Additional request parameters > Query headers > Name
Authorization

Additional request parameters > Query headers > Value
Bearer API key

Pagination > Pagination type
Next URL

Pagination > 'Next url' path
root/links/next/href

Name
Monitoring_Users
Next, create a second REST connection for the Audits API:
Request > URL
https://tenant.region.qlikcloud.com/api/v1/audits?eventType=com.qlik.user-session.begin

Additional request parameters > Query headers > Name
Authorization

Additional request parameters > Query headers > Value
Bearer API key

Pagination > Pagination type
Next URL

Pagination > 'Next url' path
root/links/next/href

Name
Monitoring_Audits
Do not forget to replace the text marked in red with the correct information for you tenant.
Step 2 – Data model
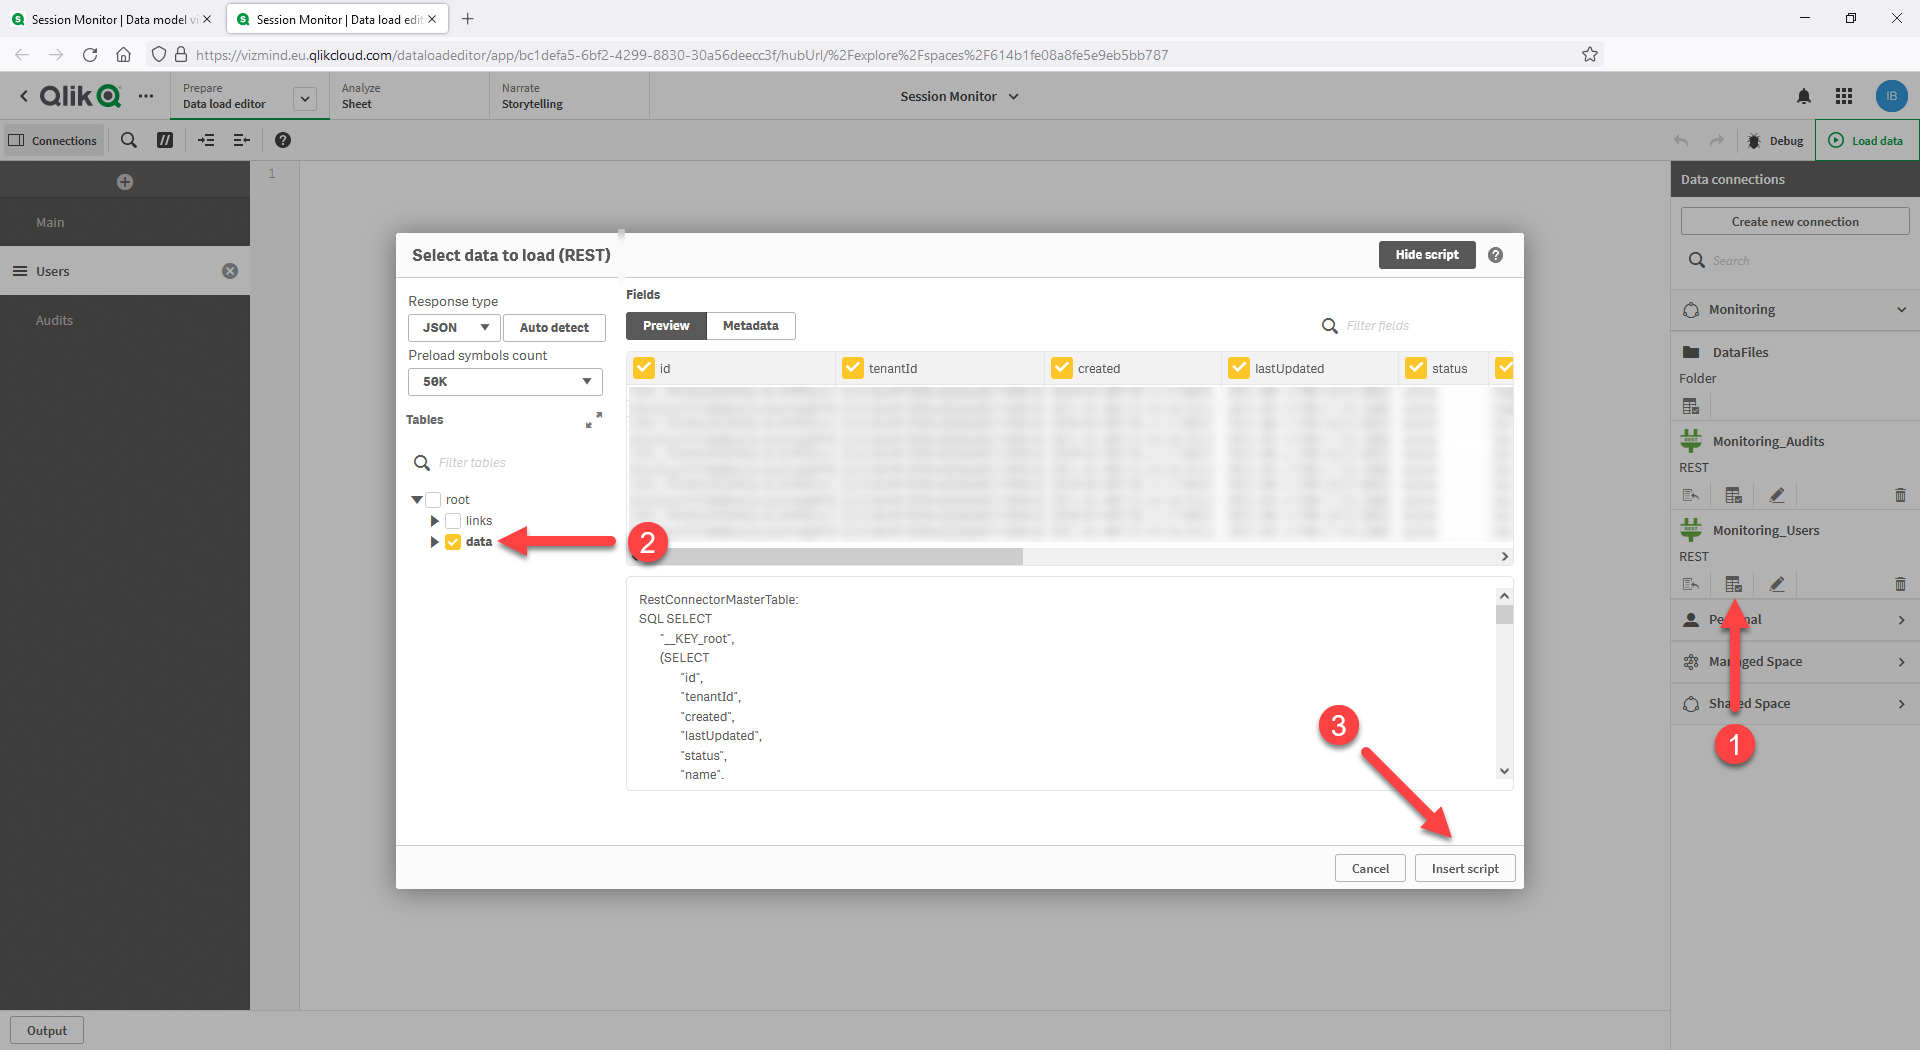
Now let’s get the data. Create two script sections – Users and Audits. In the Users section navigate to the Monitoring_Users connection, open the Select data window, mark the table data and click on Insert script.
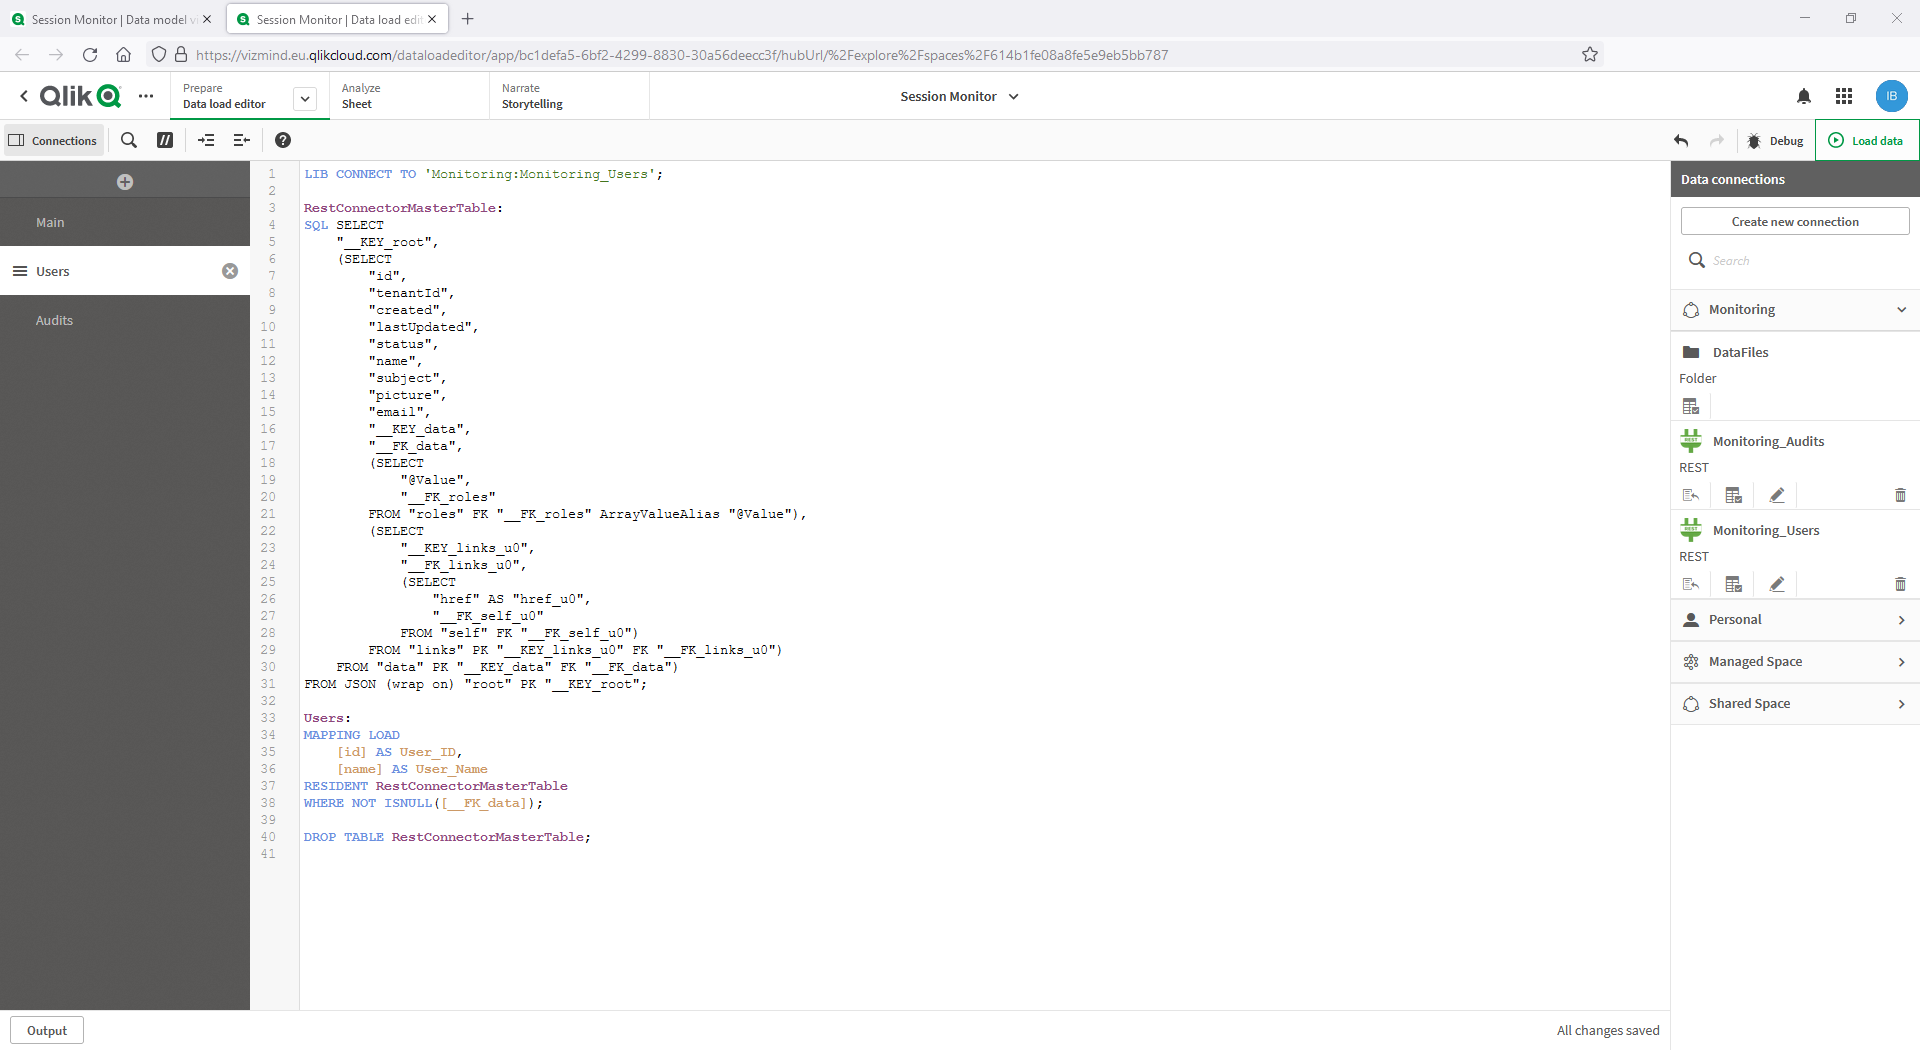
Leave the CONNECT statement and the table RestConnectorMasterTable and delete the rest from the automatically generated script. Finally, add the following lines to create a mapping table:
Users:
MAPPING LOAD
    [id] AS User_ID,
    [name] AS User_Name
RESIDENT RestConnectorMasterTable
WHERE NOT ISNULL([__FK_data]);

DROP TABLE RestConnectorMasterTable;
Your script should look like this:
Let’s move to the Audits section. This time navigate to the Monitoring_Audits connection and repeat the same as above – open the Select data window, mark the table data, insert the script and delete everything after the table RestConnectorMasterTable. Then add the lines below to your script:
Session_History:
LOAD
    [id] AS Session_Resource_Item_ID,
    [source_u0] AS Session_Event_Message_Source,
    [contentType] AS Session_Content_Type,
    [eventType] AS Session_Event_Type,
    [eventId] AS Session_Event_ID,
    [eventTime] AS Session_Event_Time,
    [tenantId] AS Session_Tenant_ID,
    [userId] AS Session_User_ID,
    [__KEY_data] AS Key
RESIDENT RestConnectorMasterTable
WHERE NOT ISNULL([__KEY_data]);

STORE Session_History INTO [lib://Monitoring:DataFiles/Session_History.qvd](qvd);

DROP TABLE RestConnectorMasterTable;
DROP FIELD Key;
Now load the data. The session history of the past 90 days will be stored as a QVD file in the DataFiles folder of the space. As a next step, we need to update the code to first load the historical data and then the most recent sessions. Add the below lines colored in green to your script:
Session_History:
LOAD
    *
FROM [lib://Monitoring:DataFiles/Session_History.qvd](qvd);

Session_New:
CONCATENATE (Session_History) LOAD
    [id] AS Session_Resource_Item_ID,
    [source_u0] AS Session_Event_Message_Source,
    [contentType] AS Session_Content_Type,
    [eventType] AS Session_Event_Type,
    [eventId] AS Session_Event_ID,
    [eventTime] AS Session_Event_Time,
    [tenantId] AS Session_Tenant_ID,
    [userId] AS Session_User_ID,
    [__KEY_data] AS Key
RESIDENT RestConnectorMasterTable
WHERE NOT ISNULL([__KEY_data]) AND NOT EXISTS (Session_Resource_Item_ID, id);

STORE Session_History INTO [lib://Monitoring:DataFiles/Session_History.qvd](qvd);

DROP TABLE RestConnectorMasterTable;
DROP FIELD Key;
Note that the table Session_History now loads the QVD file. The original table has been renamed to Session_New. Because of the NOT EXISTS function it loads only data that cannot be found in the QVD file.
So far so good – our data is safely stored in its raw format. There are still a couple of things to do though. We need to map the user names. Furthermore, if you check the field Session_Event_Time you will see that the date and time are in ISO format. Depending on what kind of visualizations you would like to build, you might want to have date and time as separate fields. There are many ways to do this, below is just one of them. The script uses preceding LOAD to add the two new fields to the table. Finally, note the CONVERTTOLOCALTIME function – it converts the timestamp from server time to your local time, you just need to specify the name of the place you want to use. Add this block to your script and load the data again:
Session_Data:
LOAD
    *,
    DATE(FLOOR(Session_Timestamp), 'DD.MM.YYYY') AS Session_Date,
    TIME(Session_Timestamp, 'hh:mm:ss') AS Session_Time;
LOAD
    Session_Resource_Item_ID,
    Session_Event_Message_Source,
    Session_Content_Type,
    Session_Event_Type,
    Session_Event_ID,
    CONVERTTOLOCALTIME(TIMESTAMP(TIMESTAMP#(LEFT(Session_Event_Time, 10) & ' ' & LEFT(SUBFIELD(Session_Event_Time, 'T', 2), 8), 'YYYY-MM-DD hh:mm:ss')), 'Vienna') AS Session_Timestamp,
    Session_Tenant_ID,
    Session_User_ID,
    UPPER(APPLYMAP('Users', Session_User_ID, 'N/A')) AS Session_User_Name
RESIDENT Session_History;

DROP TABLE Session_History;
Now we have our final table – Session_Data – with user names and nicely formatted date and time fields. Make sure to add your favorite master calendar and you are all set:
FirstAndLastDate:
LOAD
    MIN(Session_Date) AS FirstDate,
    MAX(Session_Date) AS LastDate
RESIDENT Session_Data;

LET vFirstDate = NUM(PEEK('FirstDate', 0, 'FirstAndLastDate'));
LET vLastDate = NUM(PEEK('LastDate', 0, 'FirstAndLastDate'));

TemporaryCalendar:
LOAD
    DATE($(vFirstDate) + ROWNO() - 1) AS TemporaryDate
AUTOGENERATE
    $(vLastDate) - $(vFirstDate) + 1;

Session_Calendar:
LOAD
    TemporaryDate AS Session_Date,
    DAY(TemporaryDate) AS Session_Day,
    WEEKDAY(TemporaryDate) AS Session_Weekday,
    WEEK(TemporaryDate) AS Session_Week,
    MONTH(TemporaryDate) AS Session_Month,
    'Q' & CEIL(MONTH(TemporaryDate) / 3) AS Session_Quarter,
    YEAR(TemporaryDate) AS Session_Year,
    'W' & WEEK(TemporaryDate) & '-' & YEAR(TemporaryDate) AS Session_Week_Year,
    DATE(MONTHSTART(TemporaryDate), 'MMM-YYYY') AS Session_Month_Year,
    'Q' & CEIL(MONTH(TemporaryDate) / 3) & '-' & YEAR(TemporaryDate) AS Session_Quarter_Year
RESIDENT TemporaryCalendar;

DROP TABLES FirstAndLastDate, TemporaryCalendar;
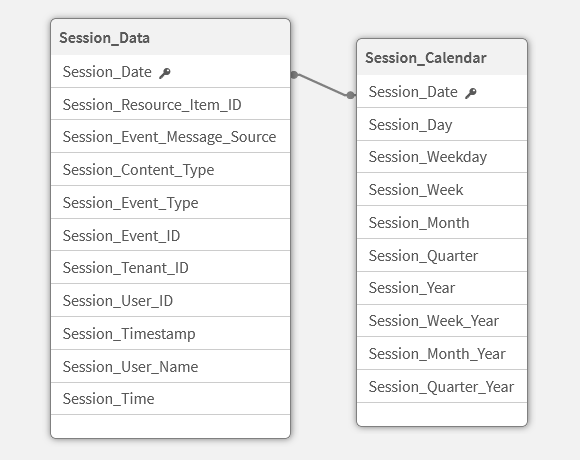
This should be your final data model:
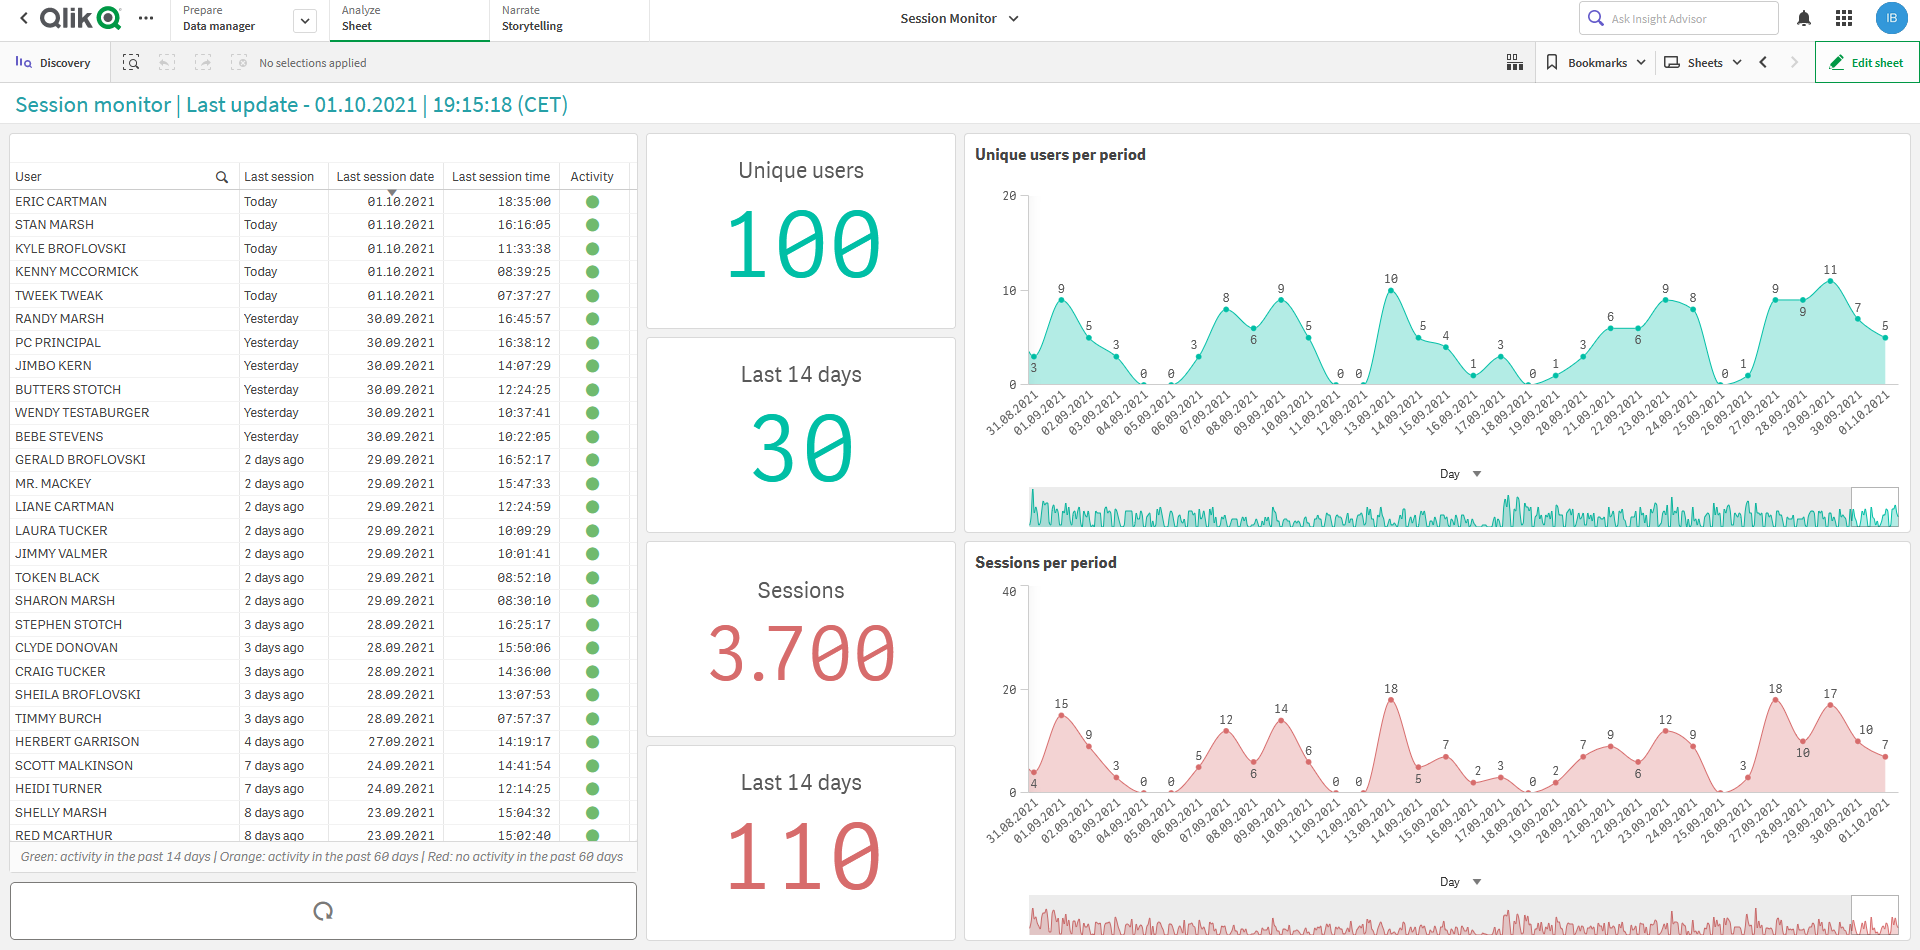
Done! Now that we have the data model, it is time for the fun part – creating the visualizations. Here an example of a simple dashboard that you could build with the available data:
I hope you found this tutorial useful. Feel free to share your session monitoring dashboard on Twitter.